2017/08/06 道の駅スタンプラリー
左上の四角をクリックすると全画面表示になります。
GPXをダウンロード (右クリックで名前を付けて保存)
NEWTRACK001(連結後)
プロフィールマップ
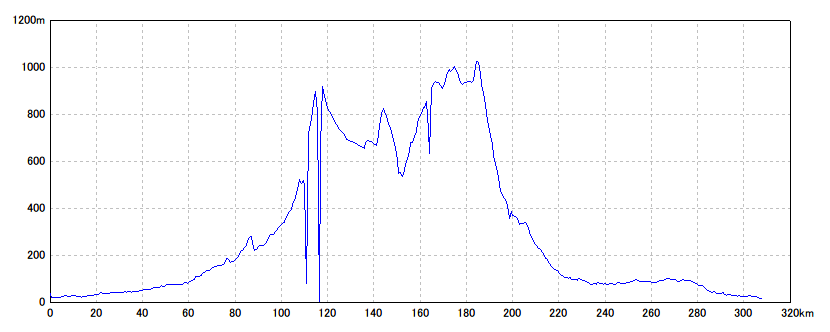
GPSログ解析
| 開始日時 | 2017/08/07 23:11:47 | 終了日時 | 2017/08/08 05:43:39 |
| 水平距離 | 307.77km | 沿面距離 | 317.42km |
| 経過時間 | 125時間15分30秒 | 移動時間 | 55時間48分40秒 |
| 全体平均速度 | 2.53km/h | 移動平均速度 | 5.64km/h |
| 最高速度 | 178.70km/h | 昇降量合計 | 13151m |
| 総上昇量 | 6578m | 総下降量 | 6573m |
| 最高高度 | 1042m | 最低高度 | 0m |
写真レポート
2017/08/07 23:11:47
6:27
2017/08/07 23:11:47
7:23
<style>
table#chart { width:600px; border: solid 1px #d1d1d1; border-collapse: collapse; }
table#chart tr { background:#ffffff; }
table#chart th,
table#chart td { width:14.28%; padding: 4px; border: solid 1px #d1d1d1; border-collapse: collapse; }
table#chart th { font-weight: bold; color: #fff; background: #ff6633; line-height: 1.0em; }
table#chart th spa
2017/08/07 23:11:48
9:12
<style>
table#chart { width:600px; border: solid 1px #d1d1d1; border-collapse: collapse; }
table#chart tr { background:#ffffff; }
table#chart th,
table#chart td { width:14.28%; padding: 4px; border: solid 1px #d1d1d1; border-collapse: collapse; }
table#chart th { font-weight: bold; color: #fff; background: #ff6633; line-height: 1.0em; }
table#chart th spa
2017/08/07 23:11:48
10:24
<style>
table#chart { width:600px; border: solid 1px #d1d1d1; border-collapse: collapse; }
table#chart tr { background:#ffffff; }
table#chart th,
table#chart td { width:14.28%; padding: 4px; border: solid 1px #d1d1d1; border-collapse: collapse; }
table#chart th { font-weight: bold; color: #fff; background: #ff6633; line-height: 1.0em; }
table#chart th spa
2017/08/07 23:11:48
13: 6
<style>
table#chart { width:600px; border: solid 1px #d1d1d1; border-collapse: collapse; }
table#chart tr { background:#ffffff; }
table#chart th,
table#chart td { width:14.28%; padding: 4px; border: solid 1px #d1d1d1; border-collapse: collapse; }
table#chart th { font-weight: bold; color: #fff; background: #ff6633; line-height: 1.0em; }
table#chart th spa
2017/08/07 23:11:48
14:25
<style>
table#chart { width:600px; border: solid 1px #d1d1d1; border-collapse: collapse; }
table#chart tr { background:#ffffff; }
table#chart th,
table#chart td { width:14.28%; padding: 4px; border: solid 1px #d1d1d1; border-collapse: collapse; }
table#chart th { font-weight: bold; color: #fff; background: #ff6633; line-height: 1.0em; }
table#chart th spa
2017/08/07 23:11:49
16:21
<style>
table#chart { width:600px; border: solid 1px #d1d1d1; border-collapse: collapse; }
table#chart tr { background:#ffffff; }
table#chart th,
table#chart td { width:14.28%; padding: 4px; border: solid 1px #d1d1d1; border-collapse: collapse; }
table#chart th { font-weight: bold; color: #fff; background: #ff6633; line-height: 1.0em; }
table#chart th spa
2017/08/07 23:11:49
17: 3
<style>
table#chart { width:600px; border: solid 1px #d1d1d1; border-collapse: collapse; }
table#chart tr { background:#ffffff; }
table#chart th,
table#chart td { width:14.28%; padding: 4px; border: solid 1px #d1d1d1; border-collapse: collapse; }
table#chart th { font-weight: bold; color: #fff; background: #ff6633; line-height: 1.0em; }
table#chart th spa